

Solutions
Operating Room Efficiency, Measured in Real Time
Operating rooms are the highest-cost, highest-revenue site of service in the hospital. But the tools most teams rely on tell you what happened only after the day is over. Your EMR charts each interval; it does not measure that interval against what it should have taken, in real time, while there is still time to act.
You can’t manage what you can’t measure
Your operating rooms are the most expensive service in the hospital, at about $47 a minute per room. Most teams still manage them with no live view of where the minutes go. Synchrony Surgical allows you to define operating room expectations, track every case in real time, and turn the minutes you save into dollars.
$47
per minute, per room: the published industry cost of running an operating room. Small inefficiencies compound fast.
210
surgical metrics to manage in a single day across 6 rooms running 6 cases each. Tracking that by hand, in real time, is not possible.
0
real-time visibility into which room is behind, who is accountable, and where the minutes went. That is the reality in most ORs today.
Getting started with Synchrony Surgical
You can easily improve your operating room efficiency with Synchrony Surgical by defining your workflow, displaying performance live across every room, and analyzing what changed.
Your workflow, your targets
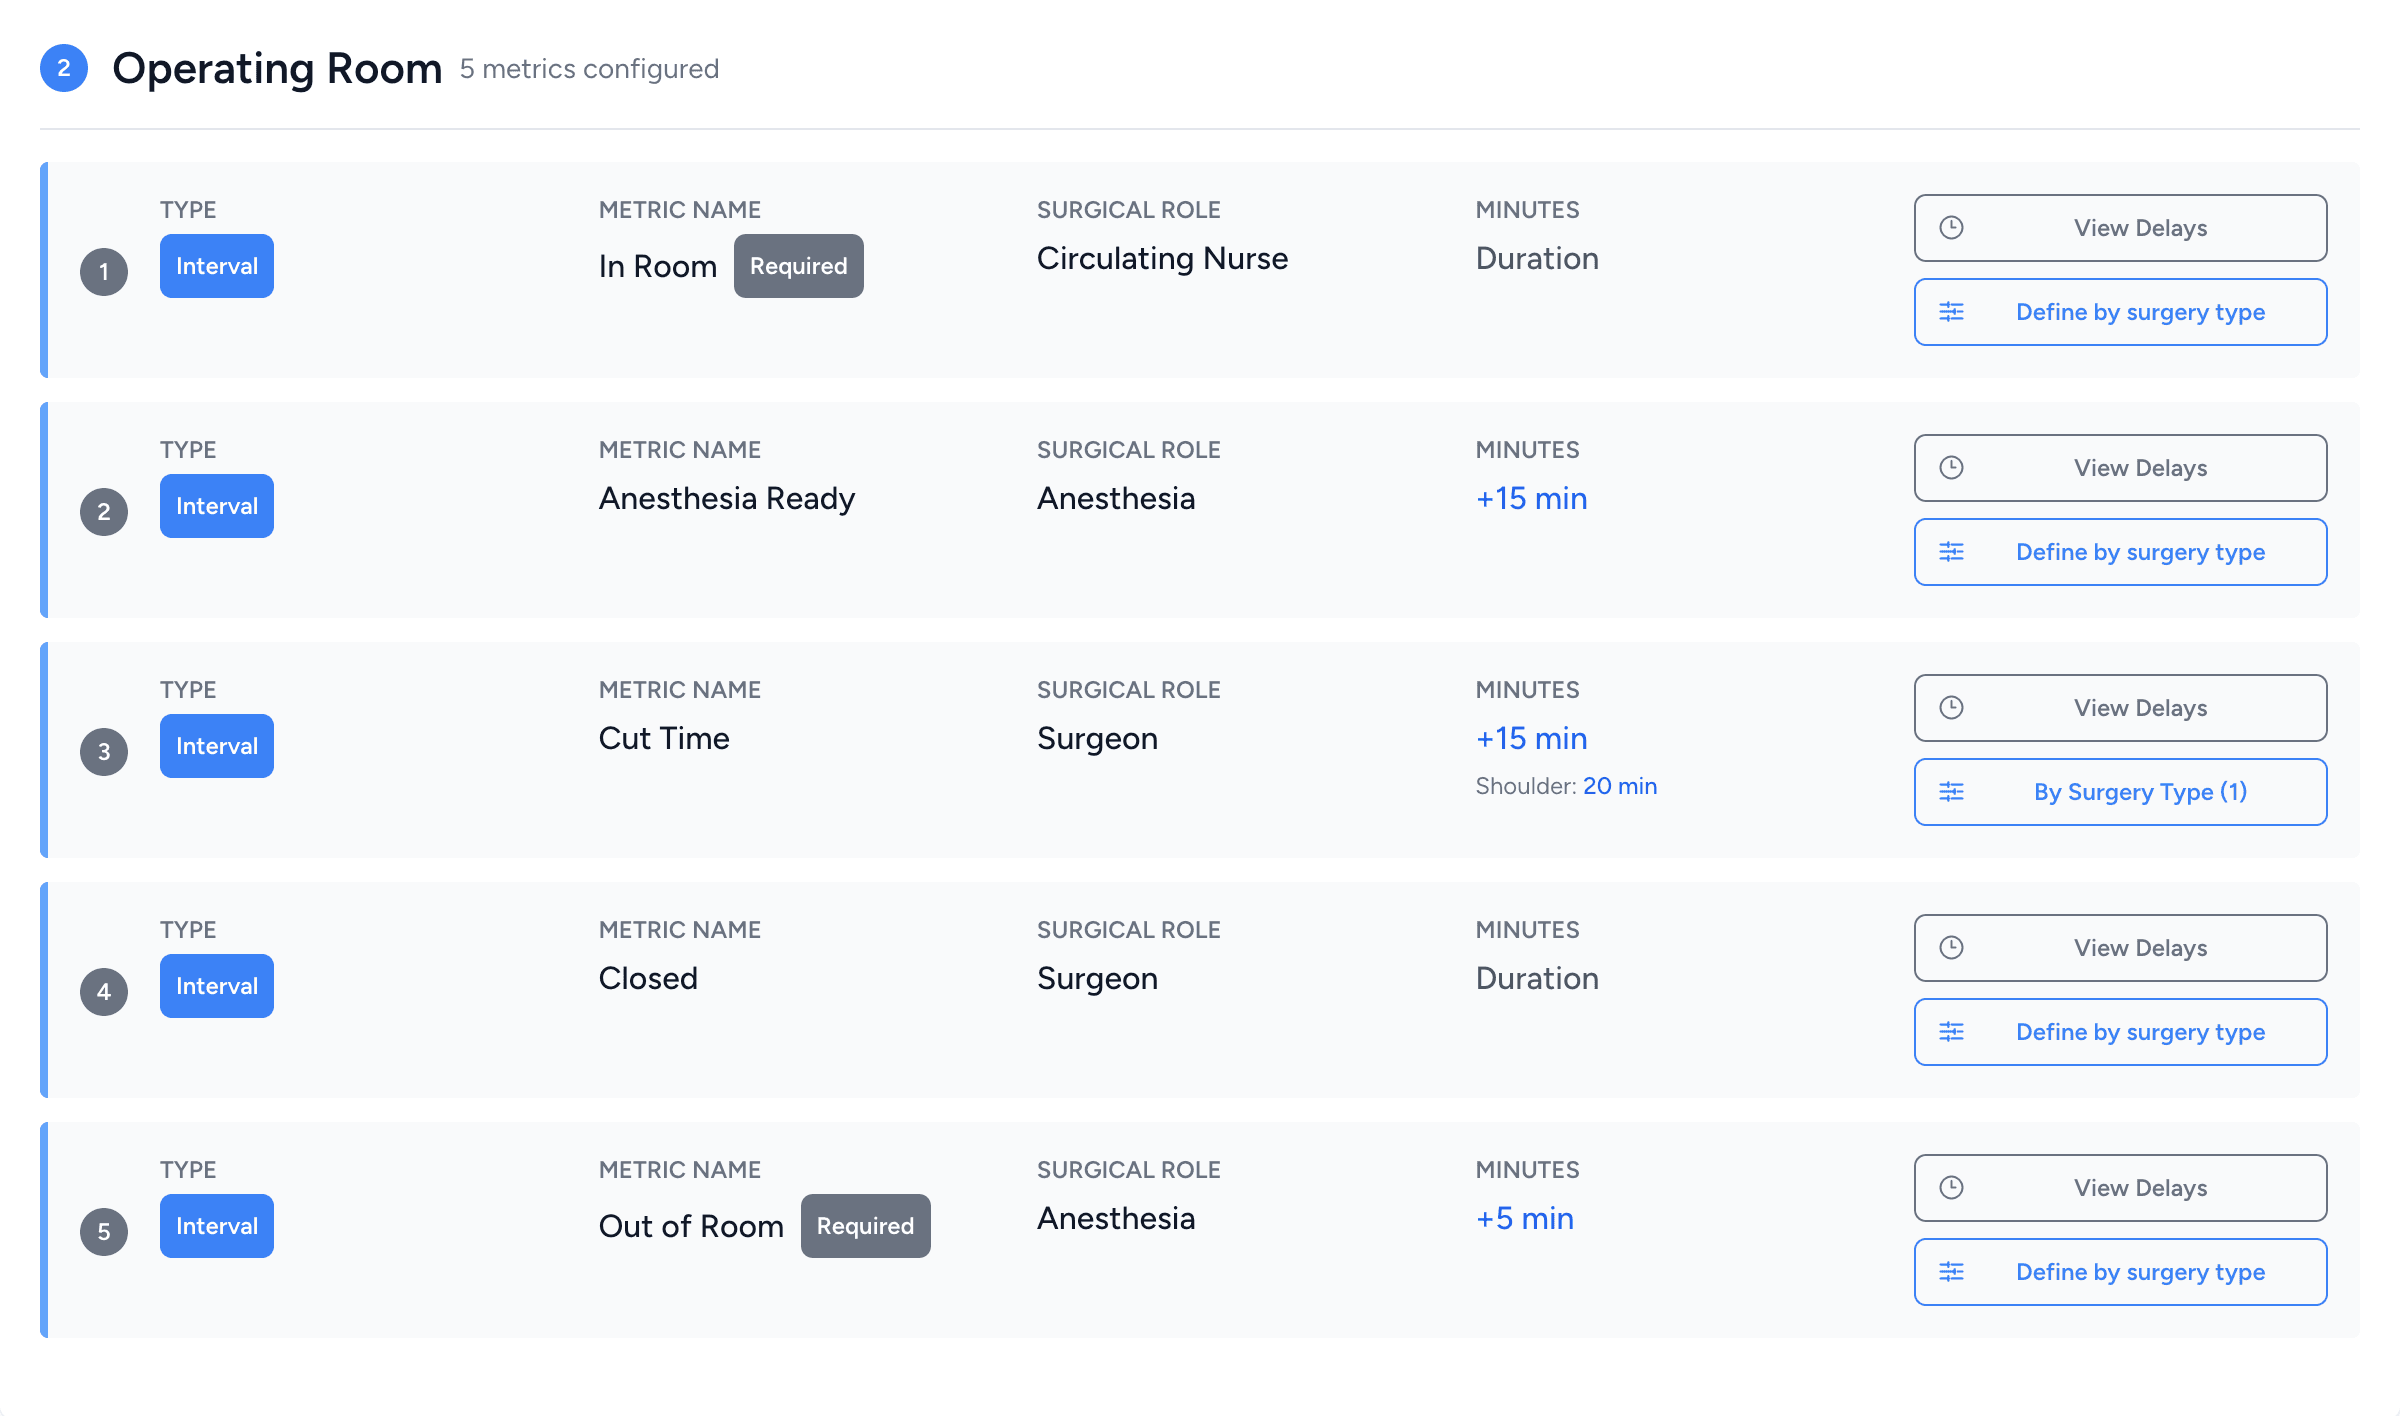
You create the intervals that matter to you, set a time expectation for each, and assign each one to a specific surgical role. Expectations can vary by department and by case type. The standards belong to the hospital, not to an algorithm.
Live, across every room
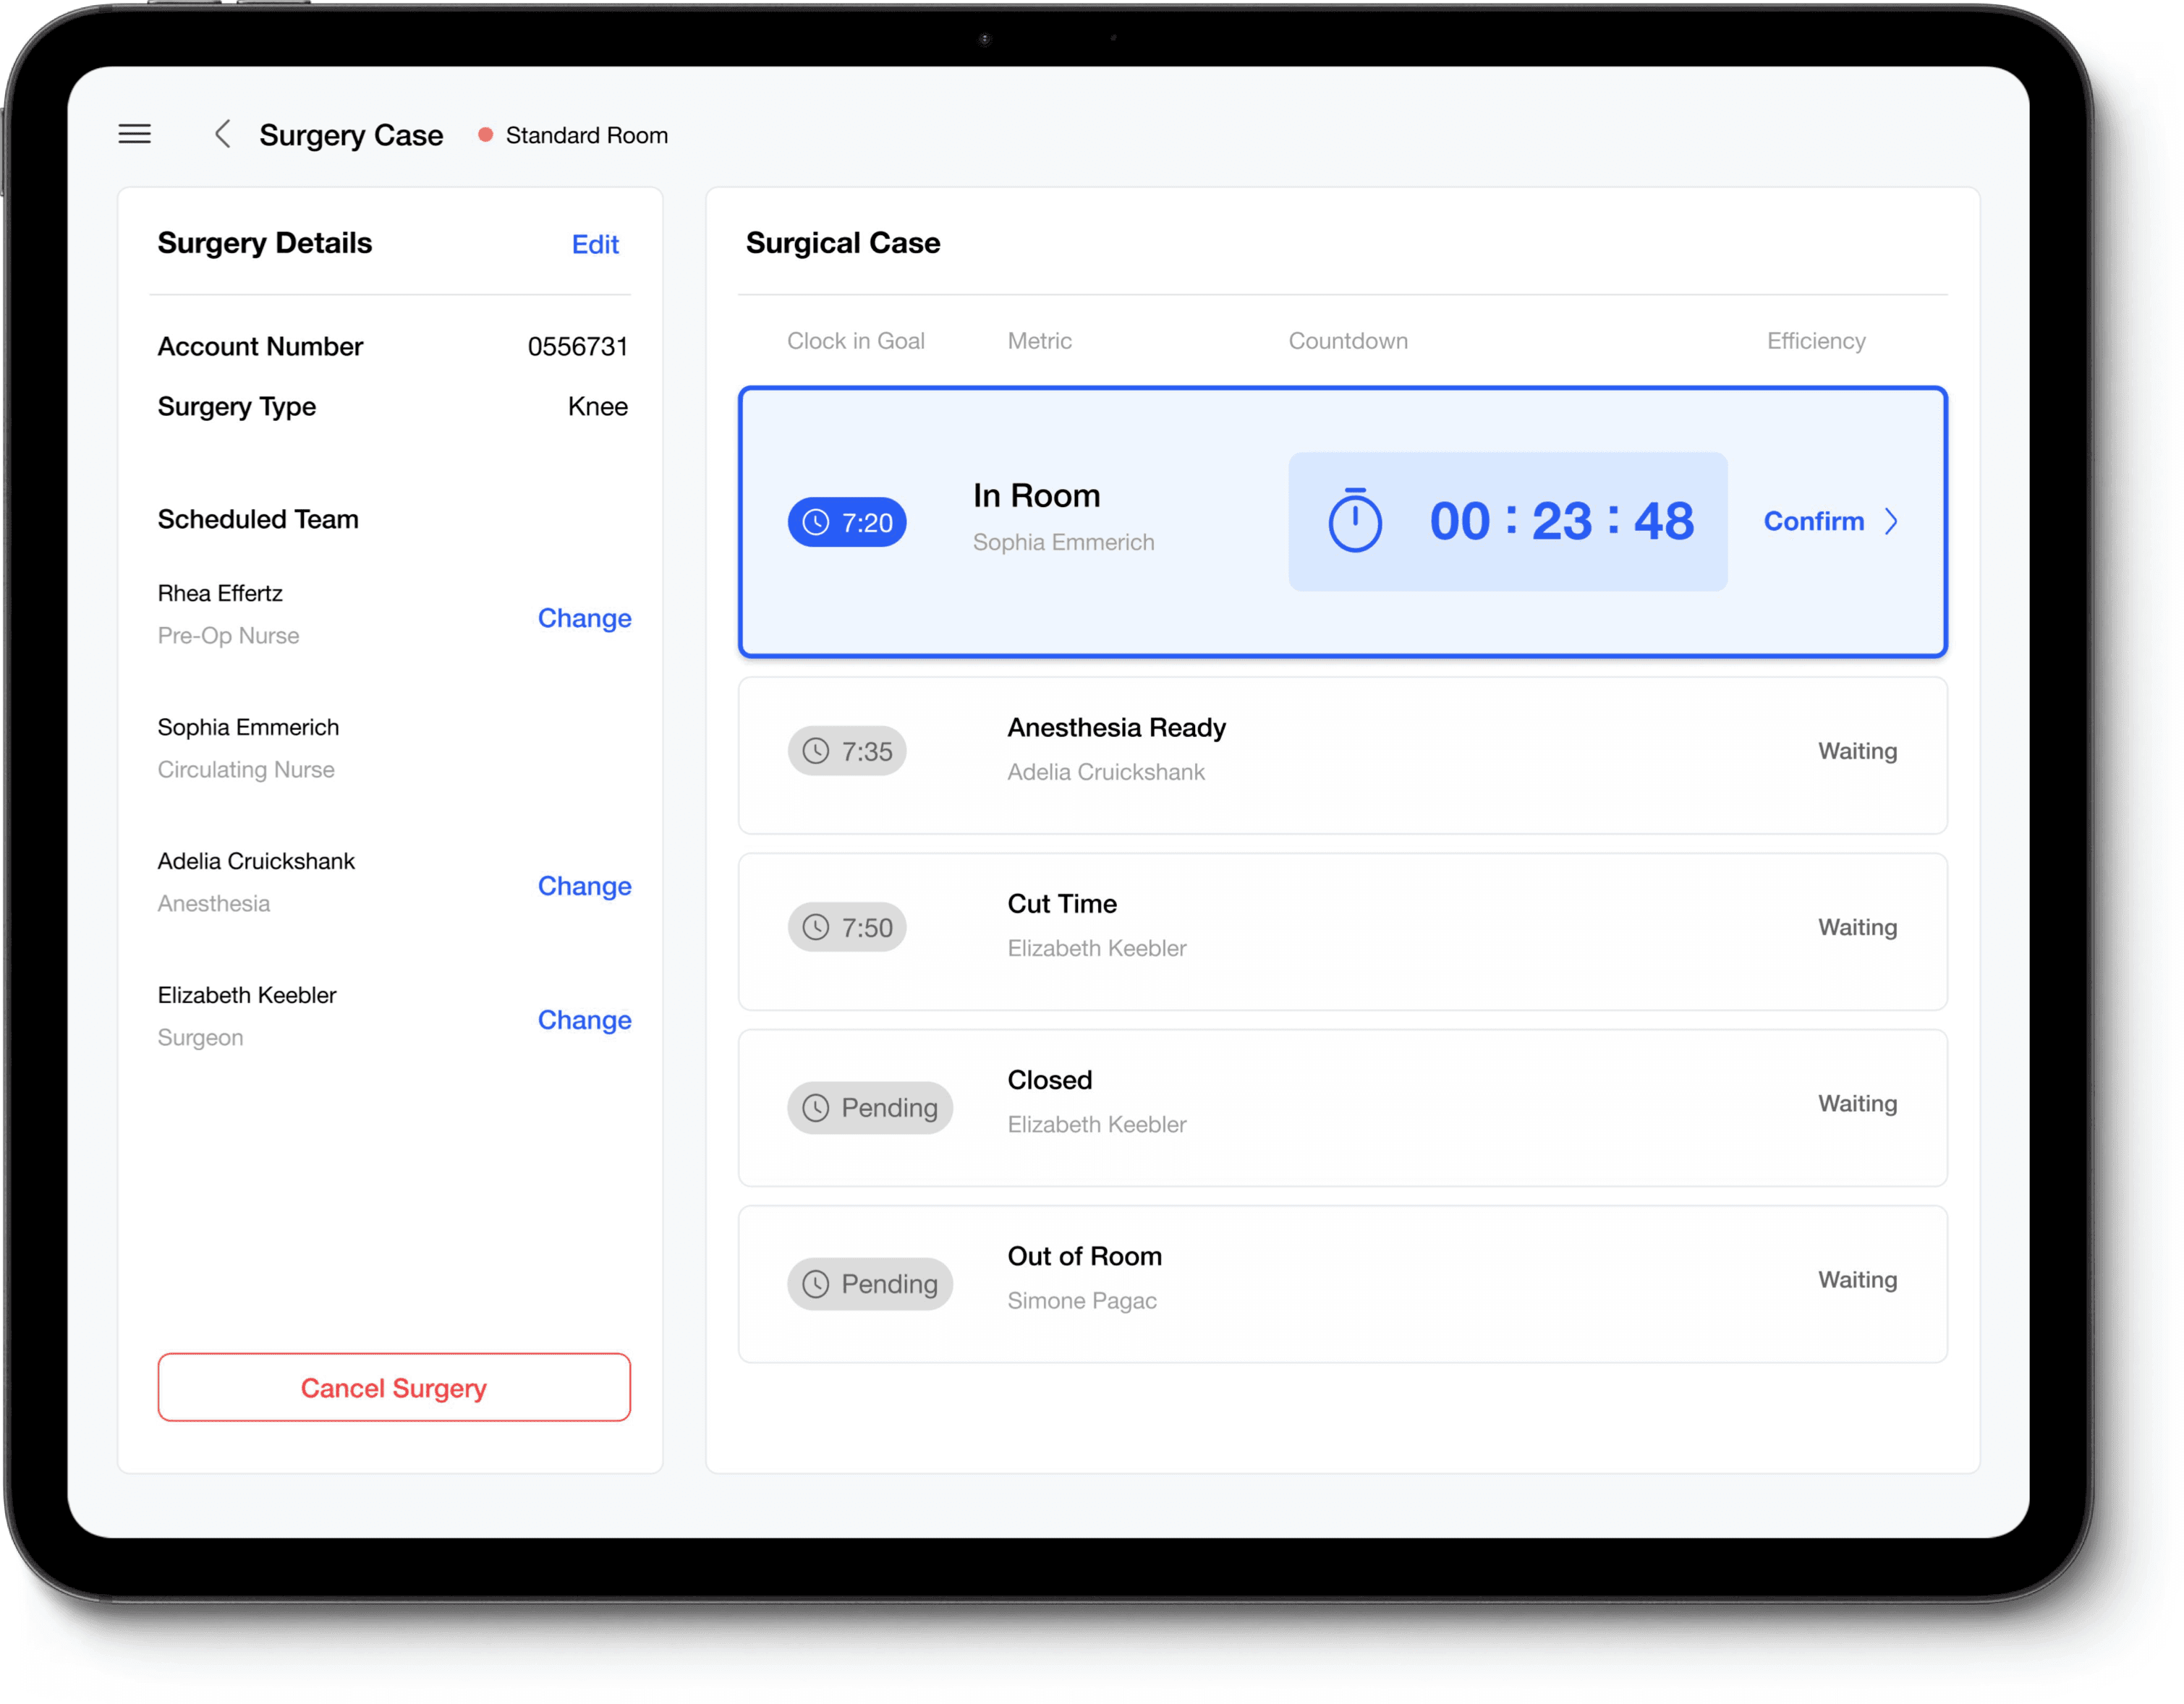
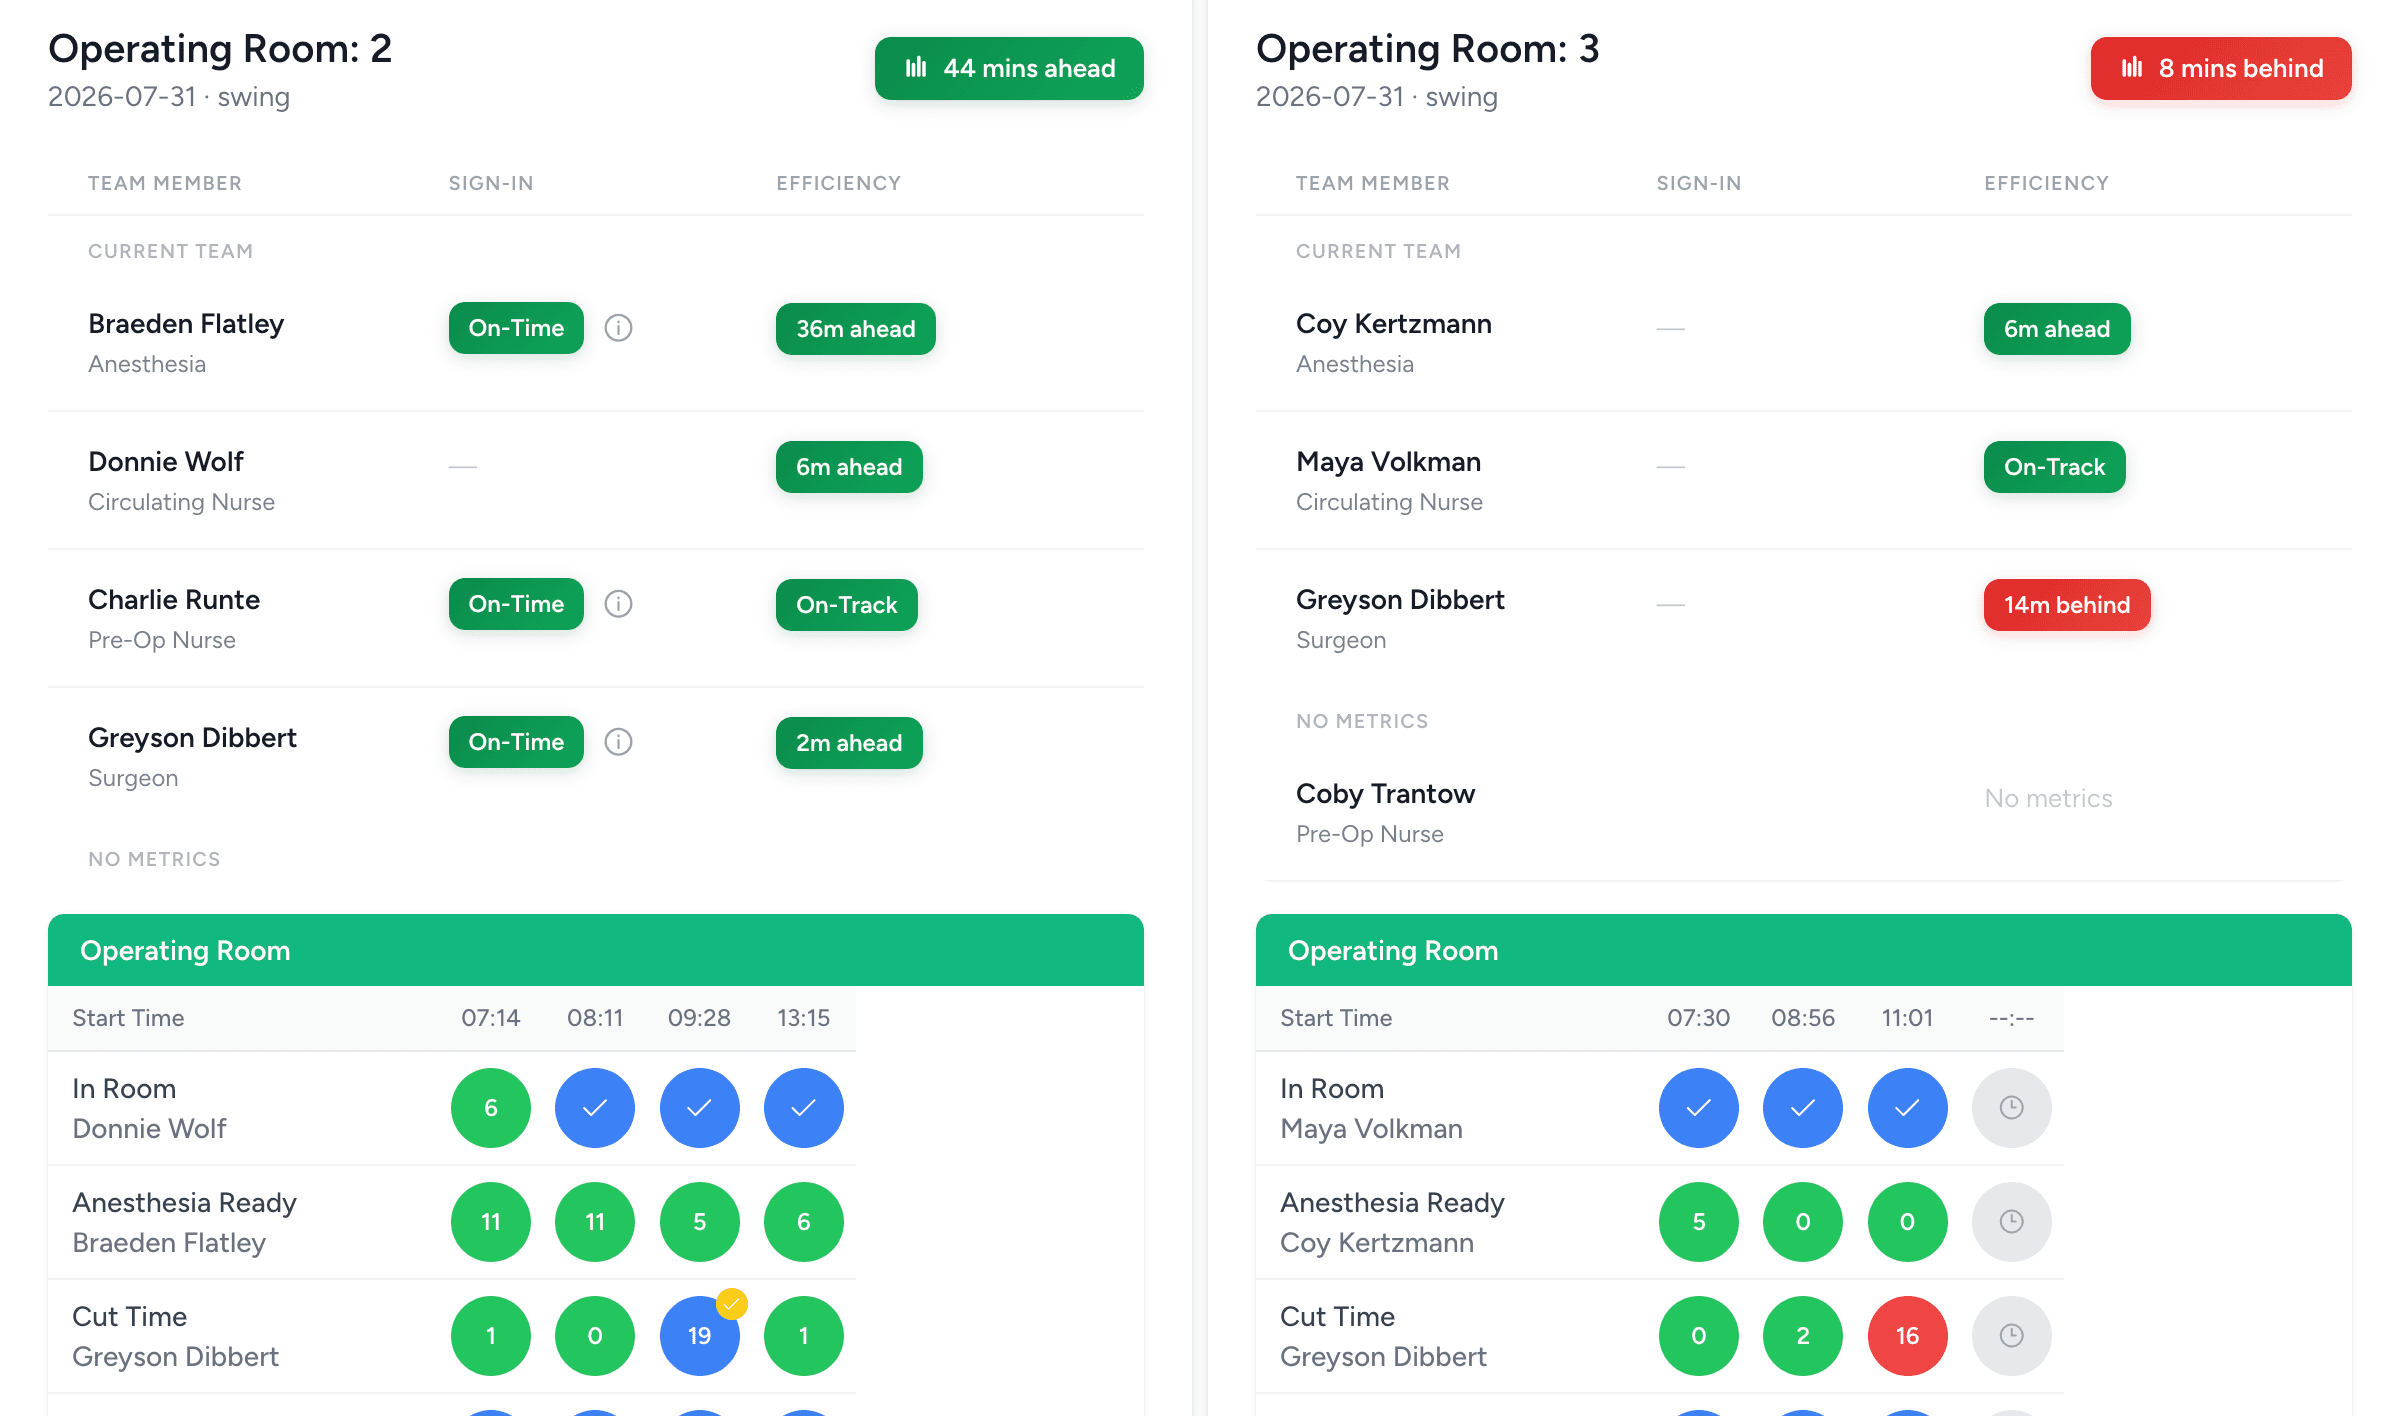
Staff confirm each interval on the tablet: one tap, five per case. Every confirmation reaches the admin analytics dashboard and the in-OR performance display at once. A room falling behind surfaces while there is still time to act.
What changed, and by how much
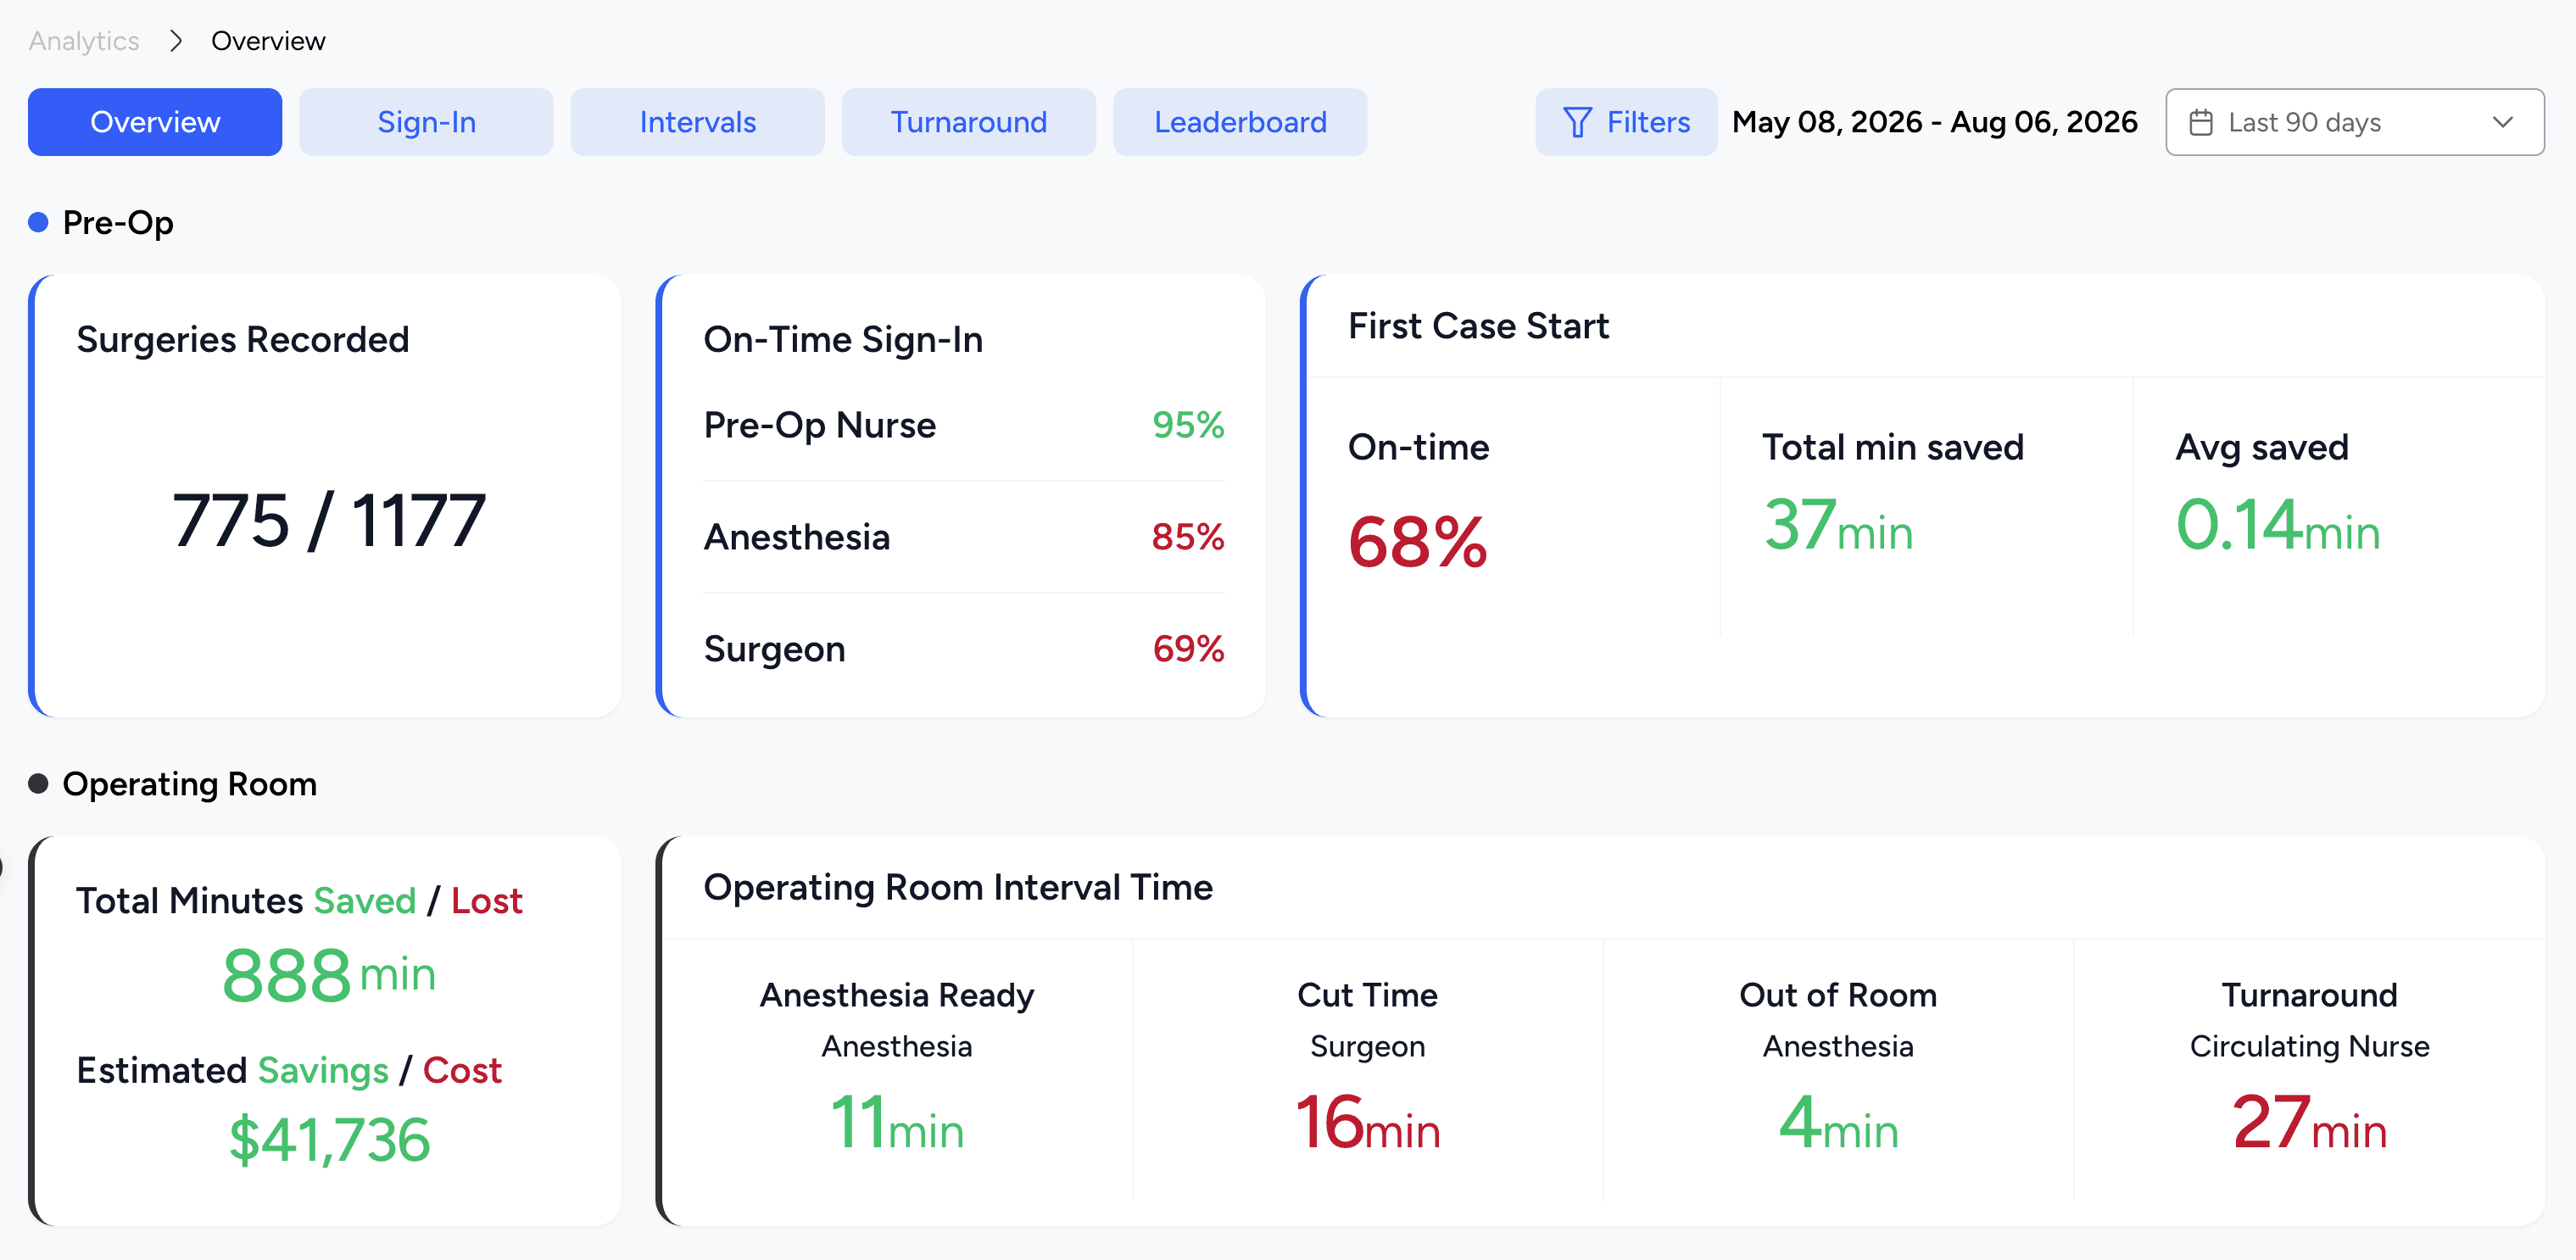
Performance slices by role, by individual, by department, and by period. Minutes convert to dollars on screen. When the data shows an expectation was set wrong, you revise it in Define and start measuring against the corrected target.
See how Synchrony measures every interval across the full platform.
Not another retrospective report
Real-time, not after the fact
An EMR records what happened. Synchrony measures each interval against its expectation as the case runs, so a delay is something you can still act on today.
Accountability by role
Every interval is assigned to a specific surgical role. Minutes saved or lost are attributed to the person responsible, not just to the room. The attribution works in both directions, so no one is blamed for a delay that wasn’t theirs.
Turnaround, tracked
Most systems don’t measure the time between cases. Synchrony does, and it is often the single metric that shows where a full day’s capacity is quietly lost. See turnaround time tracking in detail.
What your EMR does, and what it does not
Most surgical teams already record case times, and conclude from that they have what Synchrony provides. Recording a time and running an efficient room are two different jobs. The expectation agreed before the case, the live display that changes what happens during it, and the analysis that raises the standard afterwards all sit around the data point, and that is where the minutes are.
| Capability | Synchrony | Your EMR |
|---|---|---|
| Communication of expectations | Provided | Not provided |
| Pre-op readiness | Provided | Not provided |
| Anesthesia on-time sign-in | Provided | Not provided |
| Surgeon on-time sign-in | Provided | Not provided |
| First case in room | Provided | Provided |
| In Room to Anesthesia Ready | Provided | Not provided |
| Anesthesia Ready to Cut | Provided | Not provided |
| Cut to Close | Provided | Provided |
| Close to Out of Room | Provided | Provided |
| Turnaround time recorded | Provided | Provided |
| Turnaround surfaced as a live metric | Provided | Not provided |
| Reasons for delay | Provided | Not provided |
| Real-time display driving performance | Provided | Not provided |
| Automated and customizable analytics | Provided | Not provided |
| Data visible without a manual export | Provided | Not provided |
Your EMR covers four of the fifteen. All four are timestamps it writes down after the fact, which is enough for a report and too late for the room.
Proof
Proof the method works
Defining and measuring interval expectations cut turnover from 47 to 20 minutes at the Spine & Joint Institute.
They did it manually, starting from a co-management agreement in 2012: a champion, a stopwatch, and a shared standard. As surgeons moved cases to the site that respected their time, case volume tripled over four years. Synchrony is how you run that same method across every room, without a spreadsheet and a single champion holding it together.
47 → 20
min turnover
3×
case volume, four years
2012
co-management agreement
2024
digitized with Synchrony
The rest of the surgical day
Time is lost in three places, and they compound: a late first case pushes every case behind it, and slow turnarounds push them again.
Sign-in and First Case on-time Start
Pre-Op, anesthesia, and surgeon readiness
Turnaround Time
Patient out to next patient in
See your OR minutes in dollars
Start with a 60-Day Assessment and watch the minutes add up, or measure continuously from day one. Request a demo and we’ll show you all three steps running on your own workflow.